By Mark Milke
and Lennie Kaplan
Canadian Energy Centre
Want to know why Canadian oil and gas gets so little respect from anti-oil and gas activists? It’s not because Canada’s main energy sector is somehow a miscreant on measures of carbon emissions or anything else. Instead, it is often due to three approaches: focusing only on absolute emissions and ignoring the effect of economic growth and per capita measurements; skipping over the reality of a cold northern country; and making the perfect (utopian end) the enemy of the good.
This might be why, despite considerable debate in the media and policy circles about the absolute greenhouse gas (GHG) emissions arising from the activities of Canada’s oil and gas sector, little attention has been paid to the reductions in GHG emissions intensity that have occurred within the sector over the past two decades.
Some background and a necessary definition: emissions “intensity” is the emissions rate of a given pollutant relative to the intensity of a specific activity or industrial production process. Examples include grams of carbon dioxide released per megajoule of energy produced, or the ratio of greenhouse gas emissions produced to gross domestic product (GDP).
In laymen’s terms, if an industry or an economy is growing, as are its emissions, is not immediate evidence of a negative trend. It would be akin to looking at automobile manufacturing and asserting (if this were happening) that a 20 per cent rise in the use of steel in the last decade must mean that sector is less efficient in its use of steel.
But what if that same sector was manufacturing twice as many cars, trucks and SUVs as a decade ago? Then the rise in steel use would, in fact, be evidence of a sector doing more (100 per cent more production) with less (only 20 per cent more steel).
This trend on carbon emissions intensity is occurring within Canada generally and in the oil and gas sector specifically. (And again, we are measuring carbon emissions intensity, not absolute emissions.)
For example, pair Canada’s economic growth from 2000 to 2019 with carbon emissions and here’s the record: carbon emissions intensity is down dramatically.
Between 2000 and 2019, measured in what’s known in technical terms as “megatonnes of carbon dioxide equivalent,” the greenhouse gas emissions intensity in Canada fell by 30 per cent for every billion dollars in wealth created.
Or consider Canada up against other countries on a similar measurement, carbon emission intensity per millions of U.S. dollars of GDP. Between 2000 and 2018, Canada’s GHG emissions intensity fell from 996 tonnes of CO2e per million dollars of GDP to 445 tonnes, a decline of over 55 per cent.
As of 2018, Canada’s GHG emissions intensity on that measurement was lower than many other energy-producing and energy-consuming countries, such as Qatar (522 tonnes of CO2e per million dollars of GDP), the United Arab Emirates (623 tonnes), Saudi Arabia (811 tonnes), China (843 tonnes), Oman (1,038 tonnes), and Russia, at nearly three times Canada’s “445 tonnes” intensity, at 1,193 tonnes of CO2e per million dollars of GDP.
Here is another comparison that belies the notion Canada is a laggard in carbon emissions reductions: per capita emissions.
Between 2000 and 2018, Canada’s GHG emissions intensity on that measurement—per capita— fell by 14 per cent.
Selected other countries showed deeper reductions (with some others, increases). Carbon emissions expressed as tonnes of CO2e per capita fell by 22 per cent in the United States, 24 per cent in the United Arab Emirates, 12 per cent in Qatar, and 28 per cent in Australia.
Meanwhile, over the same period, emissions per capita increased by 10 per cent in Russia, 34 per cent in Saudi Arabia, and nearly 43 per cent in Oman.
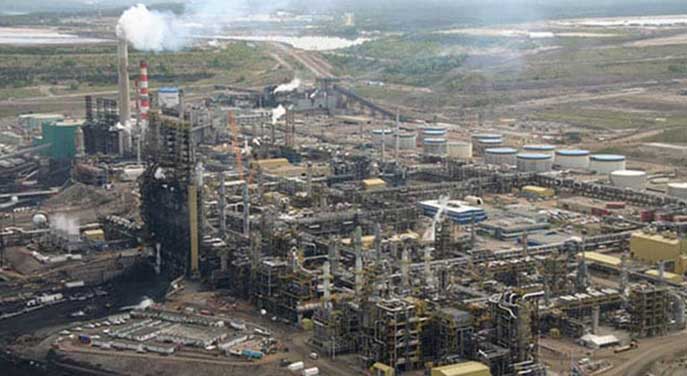
Here are some relevant statistics specific to the oil sands, always a topic of commentary: between 2011 and 2019, oil sands emissions intensity fell by nearly 22 per cent.
Looking ahead, IHS Markit speculates that improved near-term technologies and efficiencies could result in a 17 to 27 per cent reduction in the GHG intensity of steam-assisted gravity drainage operations (which accounted for 45 per cent of oil sands supply in 2017) and a 15 to 20 per cent reduction in the GHG intensity of mined oil sands by 2030.
This is similar to a base-emissions forecast from BMO Capital Markets, implying that average oil sands emissions intensity could improve by at least another 17 per cent by 2030.
Which sector spends the most on the environment? Oil and gas by Mark Milke and Ven Venkatachalam
According to IHS Markit, such improvements on a full life-cycle basis (inclusive of emissions from production to combustion) mean these upstream intensities would place average steam-assisted gravity drainage operations within two to four per cent and mined oil sands within five to seven per cent of the average for crude oil refined in the United States by 2030.
Back to the automobile manufacturing example: Whether Canada and measured by billions of dollars in new GDP, or per capita, or the oil sands, carbon emissions intensities are down. The entire country and the oil and gas sector is already doing much more with much less CO2. Recall that the next time someone compares a growing Canada to an economically stagnant country or one with a declining population.
Mark Milke and Lennie Kaplan are with the Canadian Energy Centre, an Alberta government corporation funded in part by carbon taxes. They are authors of the report Canada’s GHG Emissions Intensity Record since 2000: An Updated 2021 Analysis.
Mark and Lennie are Troy Media Thought Leaders. For interview requests, click here.
The views, opinions and positions expressed by columnists and contributors are the authors’ alone. They do not inherently or expressly reflect the views, opinions and/or positions of our publication.
© Troy Media
Troy Media is an editorial content provider to media outlets and its own hosted community news outlets across Canada.


